I borrowed the National Association of Realtors Housing Affordability Index calculation (formula available here) to look at Burleigh, Cass, and Grand Forks county housing data. The NAR published by metro area and year, but the latest release does not include Grand Forks. I assume that is a data availability issue.
I use different data than the numbers in the NAR calculation. I use median home price with a mortgage from the American Community Survey, the one year flavor (Table B25097 for those that want to see the raw data). I gather median income from the ACS too, and the mortgage rate data is for 30-year mortgages and comes from Freddie Mac (available here).
The picture of housing affordability based on this data is consistent with the calculations NAR comes up with and can be seen below:
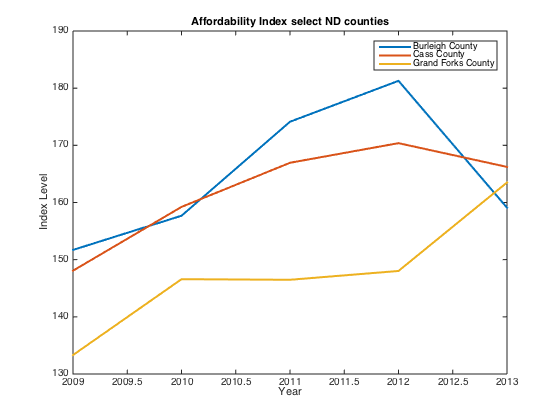
Housing Affordability Index for Burleigh, Cass, and Grand Forks Counties
The interesting thing is that according to this calculation, the median income in each county is more than capable of affording the median priced home. One of the issues with any housing price analysis is that we have sampling issues. We generally only get data about homes that are sold, which can experience significant volatility in composition from year to year. In addition, as you look at the annual median income there is some impressive volatility there too. As people move into and out of a county, or change career paths within the county the median number can change. This makes the year to year calculations a bit difficult to interpret overall. Though from the look of the graph all three counties have median income easily able to afford the median home payment. So that is good news.
I will keep looking at adjustments to the formula as well as data to see if these results hold.

This work by Flynnglis is licensed under a Creative Commons Attribution-NonCommercial 4.0 International
2 Comments, RSS